A complete overview of the software: who it is for, what it solves, and how it is used in the office and in the field. Designed for companies evaluating whether MPG is the right fit.
MPG Site Management is a platform developed for industrial construction companies, electrical maintenance teams and specialist contractors. It replaces Excel, WhatsApp and paper forms with a single system where every working hour, every installed cable and every daily report ends up in a central database, accessible to management in real time.
It runs on web for office teams and PMs, and on a native Android app for workers and supervisors. An iOS version is coming. The system is multi-site with granular permissions: each PM only sees their own job sites, and each worker only sees their assigned site.
It is not generic software. It is built specifically for the sector: the cable module manages cable tags, formations, routes, tests, cable/drum inventory and materials.
Each role has an interface designed for its work: no unnecessary screens, no useless buttons. Only the functions that are actually needed.
Creates sites and users, assigns PMs, configures roles and monitors everything from a single dashboard. Sees all data and manages the licence.
Sees only assigned job sites. Manages the team, checks BOQ and cable progress, and exports reports for the client and management.
Coordinates the field team, sees who has clocked in, records work activities, updates cable status and checks the day’s materials.
Opens the Android app, clocks IN/OUT with GPS, marks installed cables and submits daily reports. All from a phone, even without network coverage.
The typical MPG workflow: one-time setup, daily site work, progress control and report generation.
The admin creates job sites, defines GPS perimeters, imports the BOQ from Excel or the cable master list, and assigns PMs, site leads and workers to the site.
Workers clock in from their phones, mark installed cables, record installed material and send reports. The electrical supervisor checks the day’s progress, validates data entered by the teams, manages operational changes and updates materials, cables and drums in real time.
The PM sees in real time who is on site, work progress percentage, cables still to be installed and remaining inventory. No more paper sheets or manual data entry.
At the end of the day, week or progress milestone, export Excel files ready for the client: attendance, hours, cable progress and inventory status. Already formatted.
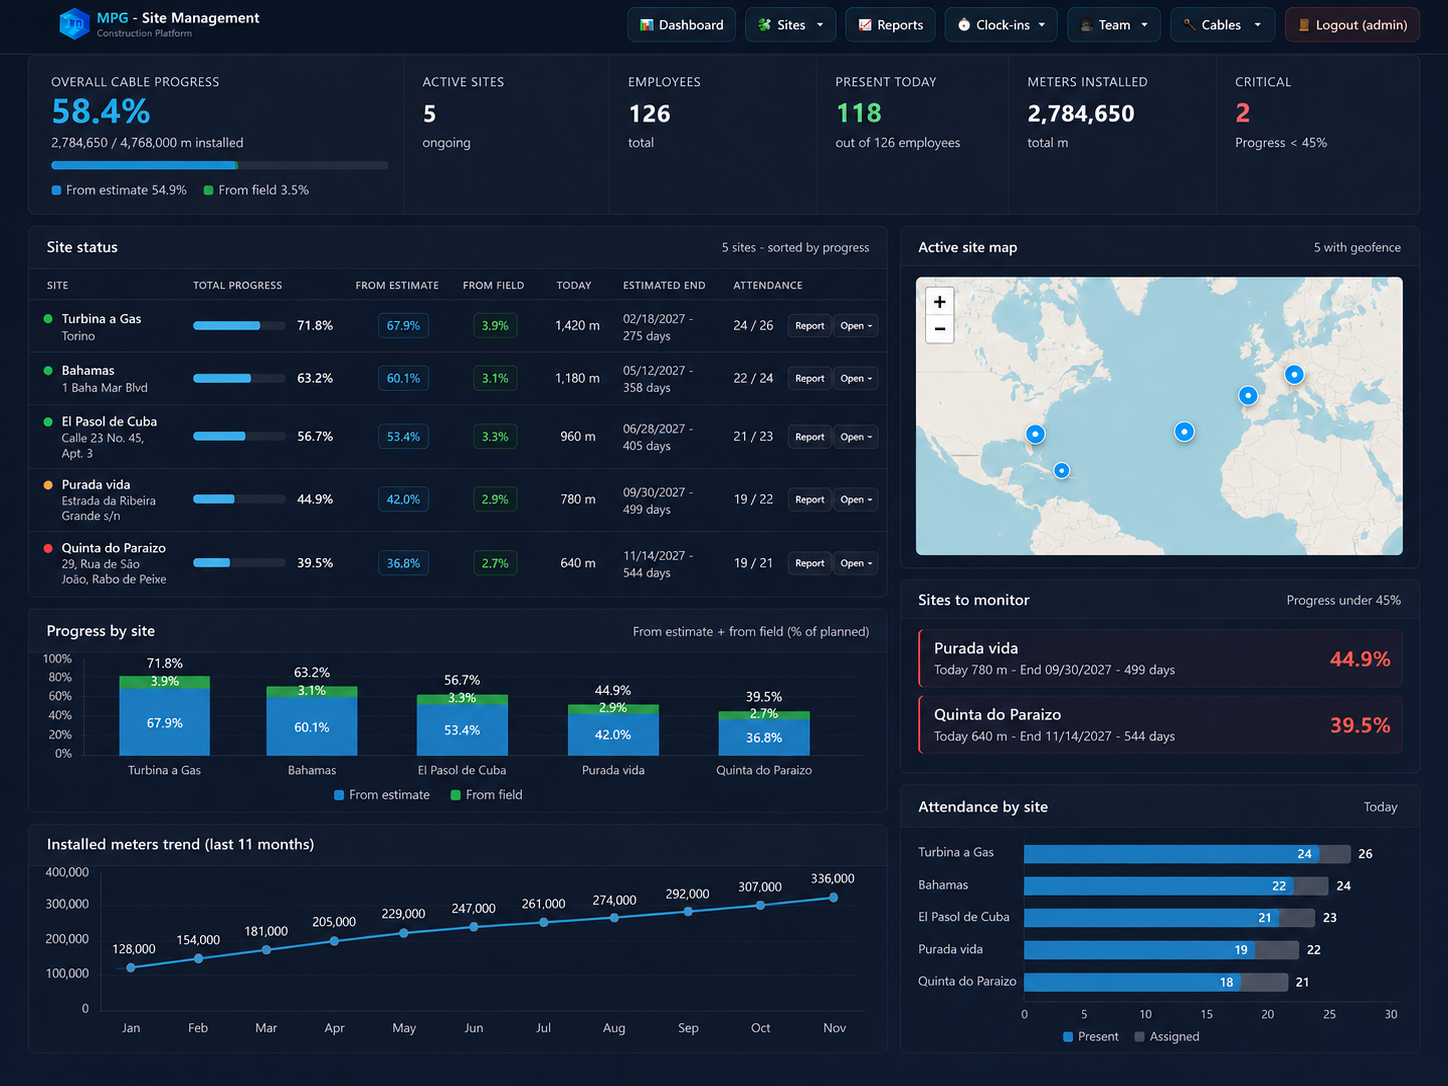
The administrative dashboard lets management monitor in real time site progress, daily attendance, installed metres, critical issues and the overall status of work activities.
Each job site is shown with progress percentages, BOQ data, field data, personnel on site and planned deadlines. This allows management to immediately identify delayed sites, sites below threshold and activities that require attention.
The integrated map shows the location of active job sites, while charts help read production trends over time without manually rebuilding data from Excel sheets, messages or separate reports.
Some modules are included in all plans, others only in Industrial . Check the pricing section to see which plan fits your needs.
Workers clock IN/OUT from the app. The system uses GPS to verify that they are actually inside the site perimeter (geofence). If they leave without clocking out, an alert is sent to the PM.
At the end of the day, each worker records what they did, on which work code, and for how many hours. Site leads validate the data. PMs see the weekly summary by employee and by site.
Import the site BOQ from Excel: each item includes description, unit of measure and planned quantity. As workers declare completed quantities, the system calculates the completion percentage.
Compare clocked hours with actual production: cables/hour, metres/hour, terminations/day per employee. Identify who is faster, who is specialised in which activity and where improvement is needed.
Manage thousands of industrial cables with alphanumeric tags, formations (e.g. 4x2.5+G), from/to routes, planned/installed lengths, connection status and tests. Direct import from the client’s Excel file.
Site drum registry with material code, length and supplier. When a worker marks a cable as “installed”, the system automatically deducts the metres from the compatible drum. Remaining balance is always updated.
For emergencies and team coordination: the admin/PM requests the real-time GPS location of one worker or the whole team on site. The request reaches the Android app as a notification and the response arrives in seconds. Available only after clock-in and strictly during working hours.
See the last known position of all employees assigned to a job site on a map. Useful for large sites (power plants, refineries, wind farms) where teams work in different areas.
Centralised management of all users: personal data, passwords, primary site, application roles (PM, site lead, worker), total and monthly working hours. PM/site-lead assignment to sites with granular permissions.
Each module includes Excel exports ready to deliver to the client or management: two-sheet cable status, attendance statistics, productivity by worker and progress milestones by site.
The supervisor or electrical supervisor dashboard makes it possible to turn BOQ items into operational activities that are easier to manage in the field.
BOQs often contain long descriptions, complex tasks, groups of cables to connect, activities to verify or phases to split across several people. The supervisor can create internal work codes, associate them with a BOQ item or a specific activity, and send them directly to the relevant workers.
This way, the worker finds the correct activity already prepared in the app for recording hours, quantities, progress or notes. They do not need to interpret the full BOQ, manually choose from dozens of items or risk entering hours in the wrong place.
The BOQ is loaded into the platform with descriptions, quantities and activities.
In standard BOQs with very detailed items, the supervisor can associate each activity with a simple, immediate code. Operators use it from their phone to record completed activities in seconds, reducing errors and entry time.
The task is sent to one person, a team or an operational group.
The worker records the work directly under the correct code, reducing errors and wasted time.
MPG does not force the company to rewrite its Excel files. The system can work with predefined templates or with a custom mode, where the client's BOQ columns are mapped to the correct platform fields.
Each project may arrive with a different BOQ: some companies split quantities by floor, others by area, zone, phase or type of activity. For electrical sites, the file may also be a cable master list, with cable code, formation, origin, destination and length.
This is why MPG manages multiple template types. When the format is standard, loading is immediate. When the client has its own file, the system uses custom mode: each file column is mapped once to the correct field in the program.
After this configuration, following sites are loaded in seconds, keeping descriptions, units of measure, quantities, zones and progress organised inside the platform.
If the client is in a hurry or does not want to configure the mappings alone, we can handle this part. The template remains saved: for future uploads, simply import the file and the system already recognises the correct columns.
| Description | UoM | QTA | Floor -1 | Ground floor | Floor 1 |
|---|---|---|---|---|---|
| RJ45 modular outlet installed in wall-mounted box | cad | 1399 | — | — | 116 |
| 4-pair twisted UTP copper cables | m | 41000 | — | — | — |
| Floor-standing cabinet complete with side panels | cad | 21 | — | — | — |
| Cable code | Formation | From | To | Length |
|---|---|---|---|---|
| 10ACA1001BAPP | 4x35+1x35G | 380 KV SUBSTATION AUX. | 400 V SERVICES SWITCHGEAR | 104 m |
| 10ACA2002CXPP | 4x2,5+G | SS MARSHALLING X | AUX. SERVICES PANEL | 39 m |
| 10ACA2003CXPP | 16x2,5+sh | SS MARSHALLING X | 380 KV PROT. PNL | 43 m |
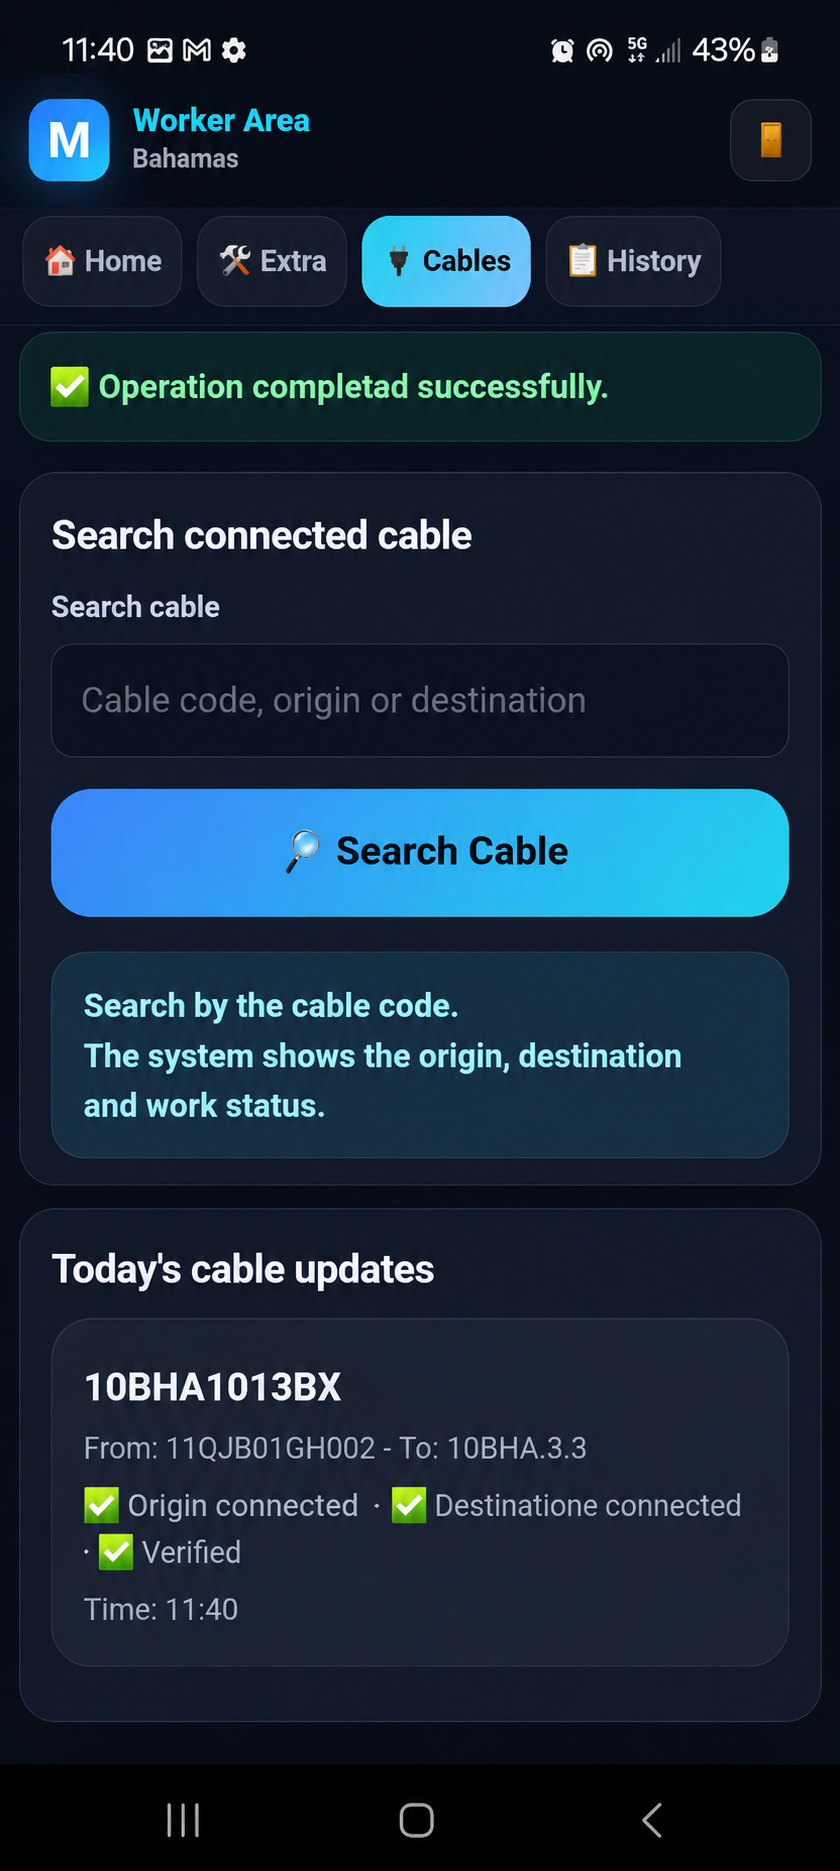
The worker app is designed for daily use on site: fast access to assigned activities, simple hour registration, completed quantity entry and submission of notes or reports. The interface minimises errors and allows work even in less-than-ideal operating conditions.
It is not a PWA that asks permission every time: it is a real app with GPS always active when authorised.
The interface can be used in Italian, English, French and Arabic, so every worker can use the most suitable language.
It syncs in the background. Workers can clock in even without network coverage: data is sent when coverage returns.
Location requests, supervisor communications and shift-change alerts arrive as phone notifications.
The app is installed through a link reserved for the client’s licence. Each installation is dedicated.